Art knows no boundaries. No matter the background or country, an artist can come from every walk of life. The question is: how diverse is the art in US museums? Do we see a commonality of nationalities, genders, or backgrounds appearing in art museums? And, which of these artists appear the most frequently?
At SINGULART, we’ve researched painting and sculpture collections from museums in the most populated cities to decipher how diverse the artists are.
In the kaleidoscopic world of art displayed across the US, we have inspected the complex diversity of nationalities, ethnicities, gender disparities, and movements that shape the narrative of artistic representation in the country’s art museums.
Our report also aimed to explore genderqueer and LGBTQ+ identifying artists, however, the lack of data available led to the exclusion of these results from the final analysis. This highlights the necessity for more comprehensive and inclusive data to accurately represent the diverse spectrum of identities within the art community.
With over 46,000 pieces of art analyzed in this report, we explore the diversity of American fine art and how a variety of nationalities, ethnic backgrounds, gender imbalances, and influential art periods are represented in institutions across the country.
What are the most common nationalities in US museums?
The US is home to such a wide variety of cultures and communities, but which nationalities come out on top here?
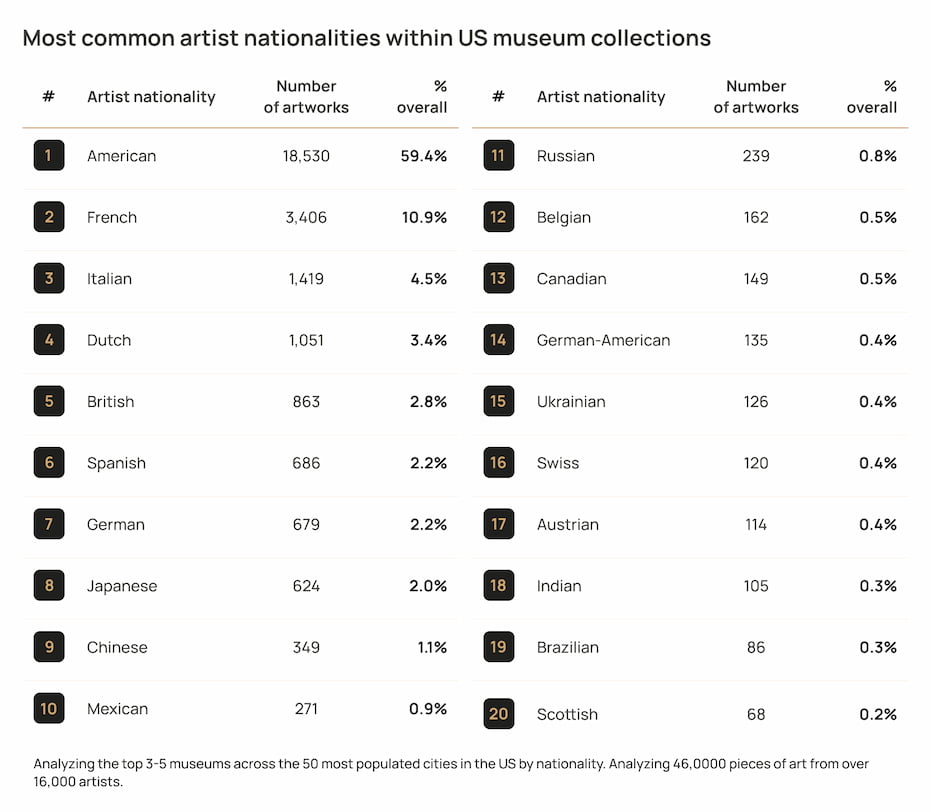
Perhaps not surprisingly, artists of an American nationality feature most frequently in the US, where art museums may be naturally inclined to display home-grown art. With over 10,000 artists assessed, a vast majority of these were American, creating 59.4% of the art we assessed.
In comparison, French, Italian, and Dutch artists were found to be the next most visible nationalities, with just over 10% of artists being French, Italians having a 4.5% representation, whilst Dutch artists accounted for 3.4% of the artwork on display.
Most common artist nationalities within US collections
Number of artworks
Artist nationality
- 1American18,530
- 2French3,406
- 3Italian1,419
- 4Dutch1,051
- 5British863
- 6Spanish686
- 7German679
- 8Japanese624
- 9Chinese349
- 10Mexican271
- 11Russian239
- 12Belgian162
- 13Canadian149
- 14German-American135
- 15Ukrainian126
- 16Swiss120
- 17Austrian114
- 18Indian105
- 19Brazilian86
- 20Scottish68
Percentage overall
Artist nationality
- 1American59.4%
- 2French10.9%
- 3Italian4.5%
- 4Dutch3.4%
- 5British2.8%
- 6Spanish2.2%
- 7German2.2%
- 8Japanese2.0%
- 9Chinese1.1%
- 10Mexican0.9%
- 11Russian0.8%
- 12Belgian0.5%
- 13Canadian0.5%
- 14German-American0.4%
- 15Ukrainian0.4%
- 16Swiss0.4%
- 17Austrian0.4%
- 18Indian0.3%
- 19Brazilian0.3%
- 20Scottish0.2%
Analyzing the top 3-5 museums across the 50 most populated cities in the US by nationality. Analyzing 46,0000 pieces of art from over 16,000 artists.
What is the most frequent ethnic background of artists in US museums?
Using the American Census to categorize each artist, we were able to broaden our research and better understand the background of each artist and see where their influences might stem from. This meant classifying artists as White, Black, American Indian, Asian, or Hispanic, as grouped by the American Census.
With only 11.6% of total artwork coming from artists of color, there is a clear bias on display in art museums. With this in mind, we took a deep dive into these numbers to see which ethnic backgrounds were really being exhibited.

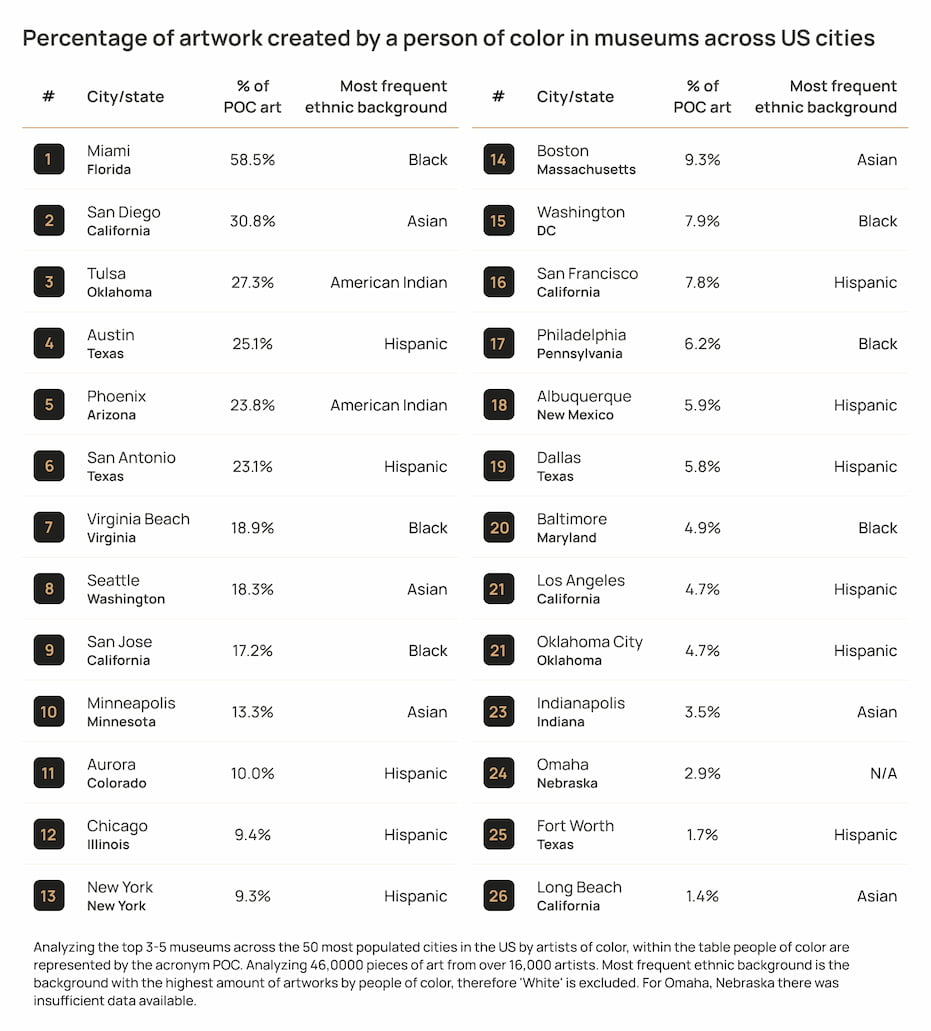
Excluding the number of White artists, Hispanic artists had created 31% of the artwork on show in US collections, with their largest representation found in the cities of Austin and San Antonio of the state of Texas. In fact, out of the top 26 cities with sufficient data, Hispanic artists were top for most frequently displayed in 11 of the cities analyzed.
Asian artists are exhibited a similar amount, with 29% of non-white artworks coming from artists with an Asian background. This was explicitly popular in San Diego, California, possibly due to its famously diverse culture and significant Asian population.
Over a fifth of non-white artists came from a Black background, with representation highest in Miami, Florida where almost 60% of artwork on display has been created by non-white artists. This rings true in Virginia Beach, Virginia too, where 18.9% of artwork was created by a person of color and the most frequent ethnicity was Black, perhaps due to its significant African American demographic.
18% of non-white artists came from an American Indian background, so if you’re seeking a city that best represents Native American cultural influences, Tulsa, Oklahoma is top. With 27.3% display of artwork created by artists of color, those from American Indian backgrounds display the most frequently. You can trace these roots to the Muscogee Nation specifically, reflecting a rich historical heritage in the state.
Percentage of artwork created by a person of color in museums across US cities
Percentage of POC art
City/state
- 1MiamiFlorida58.5%
- 2San DiegoCalifornia30.8%
- 3TulsaOklahoma27.3%
- 4AustinTexas25.1%
- 5PhoenixArizona23.8%
- 6San AntonioTexas23.1%
- 7Virginia BeachVirginia18.9%
- 8SeattleWashington18.3%
- 9San JoseCalifornia17.2%
- 10MinneapolisMinnesota13.3%
- 11AuroraColorado10.0%
- 12ChicagoIllinois9.4%
- 13New YorkNew York9.3%
- 13BostonMassachusetts9.3%
- 15WashingtonDC7.9%
- 16San FranciscoCalifornia7.8%
- 17PhiladelphiaPennsylvania6.2%
- 18AlbuquerqueNew Mexico5.9%
- 19DallasTexas5.8%
- 20BaltimoreMaryland4.9%
- 21Oklahoma CityOklahoma4.7%
- 21Los AngelesCalifornia4.7%
- 23IndianapolisIndiana3.5%
- 24OmahaNebraska2.9%
- 25Fort WorthTexas1.7%
- 26Long BeachCalifornia1.4%
Most frequent ethnic background
City/state
- 1MiamiFloridaBlack
- 2San DiegoCaliforniaAsian
- 3TulsaOklahomaAmerican Indian
- 4AustinTexasHispanic
- 5PhoenixArizonaAmerican Indian
- 6San AntonioTexasHispanic
- 7Virginia BeachVirginiaBlack
- 8SeattleWashingtonAsian
- 9San JoseCaliforniaBlack
- 10MinneapolisMinnesotaAsian
- 11AuroraColoradoHispanic
- 12ChicagoIllinoisHispanic
- 13New YorkNew YorkHispanic
- 13BostonMassachusettsAsian
- 15WashingtonDCBlack
- 16San FranciscoCaliforniaHispanic
- 17PhiladelphiaPennsylvaniaBlack
- 18AlbuquerqueNew MexicoHispanic
- 19DallasTexasHispanic
- 20BaltimoreMarylandBlack
- 21Oklahoma CityOklahomaHispanic
- 21Los AngelesCaliforniaHispanic
- 23IndianapolisIndianaAsian
- 24OmahaNebraskaN/A
- 25Fort WorthTexasHispanic
- 26Long BeachCaliforniaAsian
Analyzing the top 3-5 museums across the 50 most populated cities in the US by artists of color, within the table people of color are represented by the acronym POC. Analyzing 46,0000 pieces of art from over 16,000 artists. Most frequent ethnic background is the background with the highest amount of artworks by people of color, therefore ‘White’ is excluded. For Omaha, Nebraska there was insufficient data available.
Which US cities have the highest gender disparity in artists?
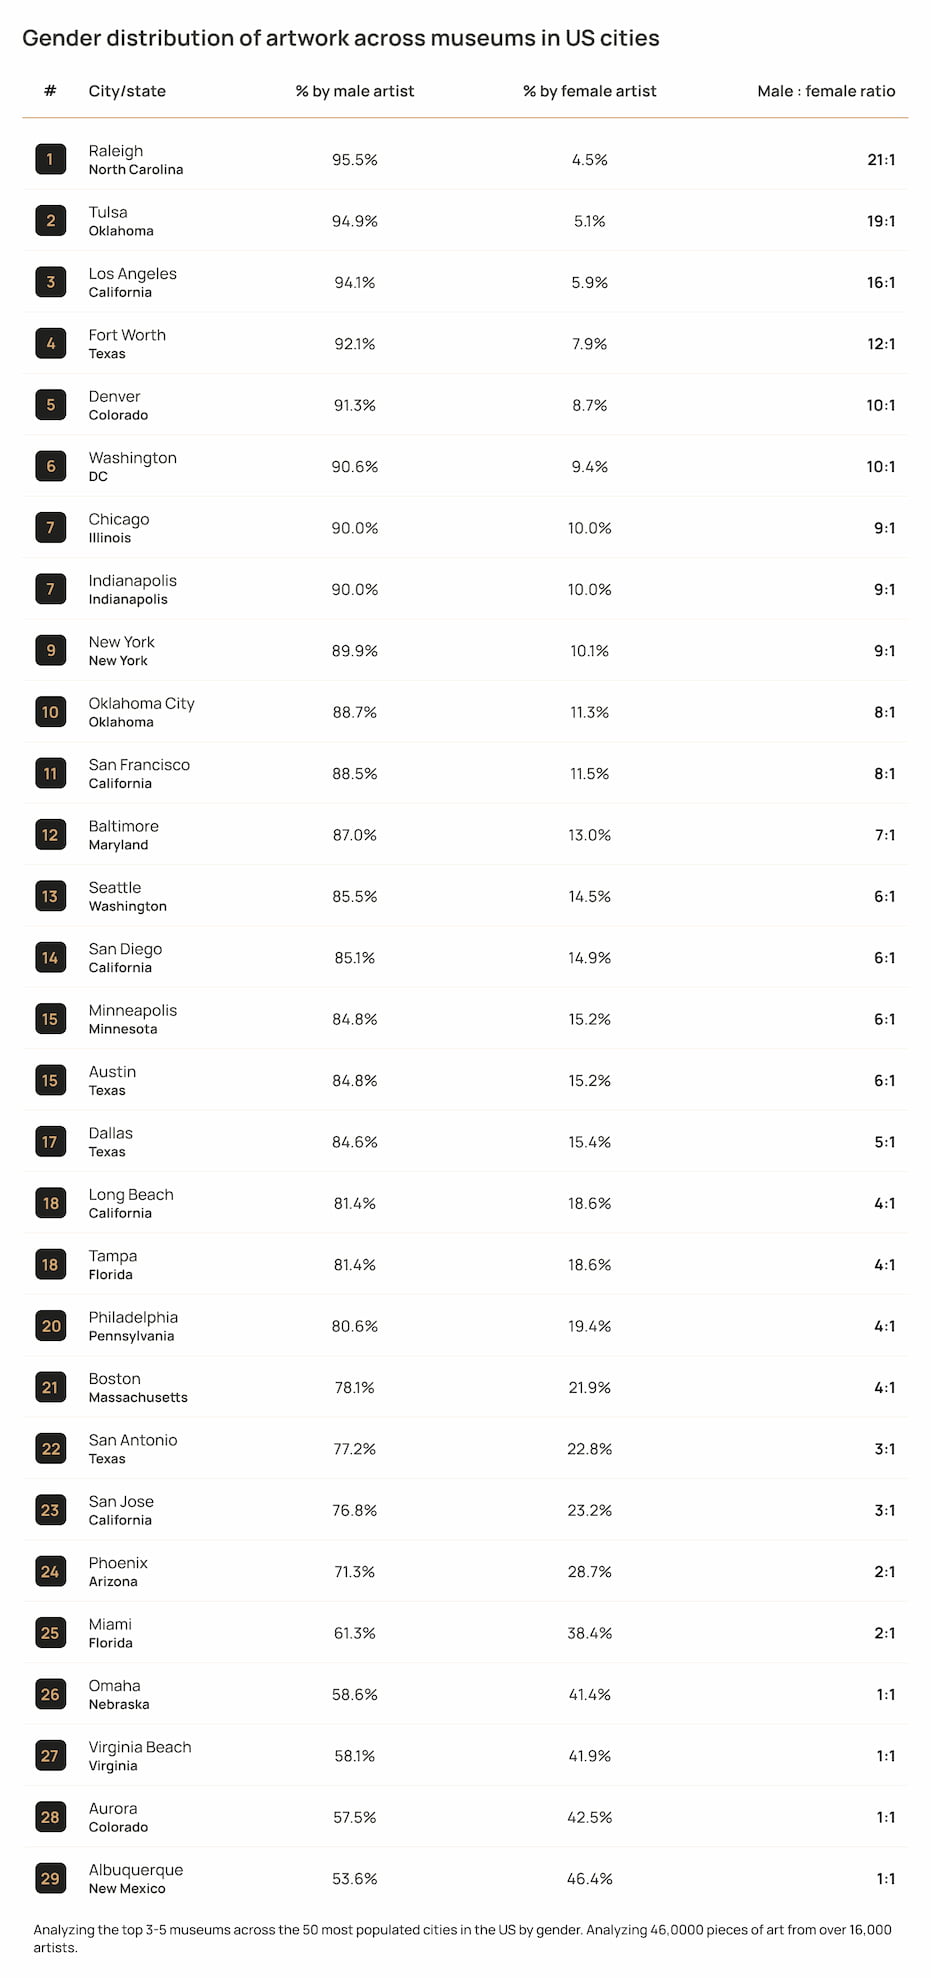
Our research found a huge gender disparity in the artwork displayed by US museums, with 86.8% of artwork coming from artists who identify as male, while just 13.2% comes from artists who identify as female. This, however, varied widely between individual cities.

Raleigh in North Carolina, for instance, portrayed the worst gender equality representation with the percentage of male artists on display coming in at 95.5% across the city’s museums, therefore leaving just 4.5% of artworks here being created by women.
Albuquerque in New Mexico, on the other hand, had the most balanced display of gender, with 53.6% of artists in the city’s museums identifying as male and 46.4% identifying as female; the smallest percentage difference across the cities.
Gender distribution of artwork across museums in US cities
Percentage by male artist
City/state
- 1RaleighNorth Carolina95.5%
- 2TulsaOklahoma94.9%
- 3Los AngelesCalifornia94.1%
- 4Fort WorthTexas92.1%
- 5DenverColorado91.3%
- 6WashingtonDC90.6%
- 7ChicagoIllinois90.0%
- 7IndianapolisIndianapolis90.0%
- 9New YorkNew York89.9%
- 10Oklahoma CityOklahoma88.7%
- 11San FranciscoCalifornia88.5%
- 12BaltimoreMaryland87.0%
- 13SeattleWashington85.5%
- 14San DiegoCalifornia85.1%
- 15MinneapolisMinnesota84.8%
- 15AustinTexas84.8%
- 17DallasTexas84.6%
- 18Long BeachCalifornia81.4%
- 18TampaFlorida81.4%
- 20PhiladelphiaPennsylvania80.6%
- 21BostonMassachusetts78.1%
- 22San AntonioTexas77.2%
- 23San JoseCalifornia76.8%
- 24PhoenixArizona71.3%
- 25MiamiFlorida61.3%
- 26OmahaNebraska58.6%
- 27Virginia BeachVirginia58.1%
- 28AuroraColorado57.5%
- 29AlbuquerqueNew Mexico53.6%
Percentage by female artist
City/state
- 29RaleighNorth Carolina4.5%
- 28TulsaOklahoma5.1%
- 27Los AngelesCalifornia5.9%
- 26Fort WorthTexas7.9%
- 25DenverColorado8.7%
- 24WashingtonDC9.4%
- 23ChicagoIllinois10.0%
- 22IndianapolisIndianapolis10.0%
- 21New YorkNew York10.1%
- 20Oklahoma CityOklahoma11.3%
- 18San FranciscoCalifornia11.5%
- 18BaltimoreMaryland13.0%
- 17SeattleWashington14.5%
- 15San DiegoCalifornia14.9%
- 15MinneapolisMinnesota15.2%
- 14AustinTexas15.2%
- 13DallasTexas15.4%
- 12Long BeachCalifornia18.6%
- 11TampaFlorida18.6%
- 10PhiladelphiaPennsylvania19.4%
- 9BostonMassachusetts21.9%
- 7San AntonioTexas22.8%
- 7San JoseCalifornia23.2%
- 6PhoenixArizona28.7%
- 5MiamiFlorida38.4%
- 4OmahaNebraska41.4%
- 3Virginia BeachVirginia41.9%
- 2AuroraColorado42.5%
- 1AlbuquerqueNew Mexico46.4%
Male : female ratio
City/state
- 1RaleighNorth Carolina21:1
- 2TulsaOklahoma19:1
- 3Los AngelesCalifornia16:1
- 4Fort WorthTexas12:1
- 5DenverColorado10:1
- 6WashingtonDC10:1
- 7ChicagoIllinois9:1
- 7IndianapolisIndianapolis9:1
- 9New YorkNew York9:1
- 10Oklahoma CityOklahoma8:1
- 11San FranciscoCalifornia8:1
- 12BaltimoreMaryland7:1
- 13SeattleWashington6:1
- 14San DiegoCalifornia6:1
- 15MinneapolisMinnesota6:1
- 15AustinTexas6:1
- 17DallasTexas5:1
- 18Long BeachCalifornia4:1
- 18TampaFlorida4:1
- 20PhiladelphiaPennsylvania4:1
- 21BostonMassachusetts4:1
- 22San AntonioTexas3:1
- 23San JoseCalifornia3:1
- 24PhoenixArizona2:1
- 25MiamiFlorida2:1
- 26OmahaNebraska1:1
- 27Virginia BeachVirginia1:1
- 28AuroraColorado1:1
- 29AlbuquerqueNew Mexico1:1
Analyzing the top 3-5 museums across the 50 most populated cities in the US by gender. Analyzing 46,0000 pieces of art from over 16,000 artists.
With this in mind, a handful of female artists with a significant influence on art history appeared repeatedly. Most remarkably, American female abstract painter O’Keeffe – known as the ‘Mother of American Modernism’ – was the second most-displayed artist out of the 10,000 we analyzed.
Similarly, 19th-century-born artists Cecilia Beaux – the first woman to teach at the Pennsylvania Academy of the Fine Arts – and Violet Oakley – the first American woman to receive a public mural commission – also appeared in the top 60 artists, evidently for their vast influence on American art.
Which is the most diverse art period in US museums?
Where there is clear evidence of a bias towards American, white, and male artists, it is necessary to investigate the time periods many of these artworks were conceptualized.
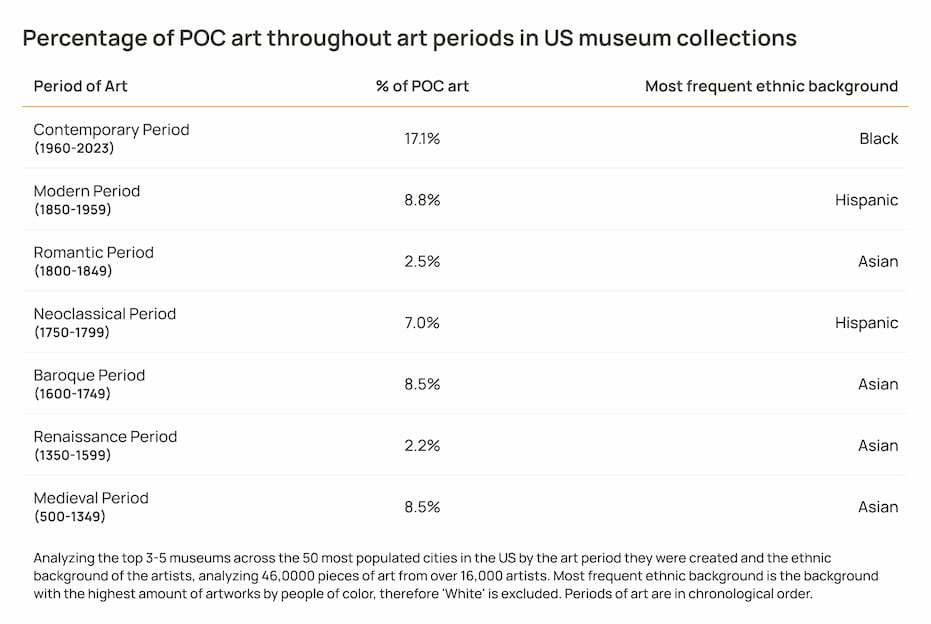
Art from the Modern Period (1850-1959) came from artists with non-white ethnic backgrounds 8.8% of the time, with a huge jump to 17.1% in the developing Contemporary Period (1960-2023). This increase is largely due to the revolution of cultural movements at the time, allowing for greater access to more diverse art types including multiculturalism and post-colonialism.
Where the Contemporary Period saw a leap into artwork from artists of color, this is likely due to the civil rights movement and the increased globalization of art at the time. Where the most frequent ethnic background of art was Black, there seems to be a strong correlation between the art period and the culture surrounding it.
Although there was a significant improvement in representation during the Contemporary Period, we do see fluctuations across history. For instance, the Renaissance Period (1350-1599) and Romantic Period (1800-1849) have a particularly low demographic representation, where just 2% of the art at the time was produced by people of color.
Compared to this, though, the remaining periods hover at around 8.5% for non-white communities, going as far back as the Medieval ages (500-1349), showing variability in ethnic representation throughout history.
All art periods other than the Contemporary Period see Hispanic and Asian artists as the most frequent non-white ethnicity. This, therefore, suggests that although there has been a lower number of ethnic representations across the centuries, there is an underlying illustration of POC art over time, as well as a growing diversification of the art in museums.
Percentage of POC art throughout art periods in US museum collections
Period of art
Most frequent ethnic background
- Contemporary Period(1960-2023)17.1%Black
- Modern Period(1850-1959)8.8%Hispanic
- Romantic Period(1800-1849)2.5%Asian
- Neoclassicism / Neoclassical Period(1750-1799)7.0%Hispanic
- Baroque Period(1600-1749)8.5%Asian
- Renaissance Period(1350-1599)2.2%Asian
- Medieval Period(500-1349)8.5%Asian
Analyzing the top 3-5 museums across the 50 most populated cities in the US by the art period they were created and the ethnic background of the artists, analyzing 46,0000 pieces of art from over 16,000 artists. Most frequent ethnic background is the background with the highest amount of artworks by people of color, therefore ‘White’ is excluded. Periods of art are in chronological order.
Who are the most common artists in US museums?
When it comes to individual artists, there is an array of classic American names that appear frequently across museums. Thanks to their familiarity among local audiences, it’s perhaps no surprise that American artists like Joseph Henry Sharp, George Catlin, Olaf Carl Seltzer, and William Robinson Leigh take the lead in the top 10.
We found the 10 most-displayed artists to be American white males, with the exception of the previously mentioned Georgia O’Keeffe in second place, and French male artist Auguste Rodin who takes the eighth spot. Of the top 50 artists portrayed in US museums, over half of these were American white males.
Looking at the geographical diversity of the top 20 US artists, we found plenty of the household names you might expect including Auguste Rodin, Claude Monet, and Henri Matisse all from France, and Pablo Picasso from Spain. Classic art names seen regularly due to their global reputations and impact on art styles such as Impressionism and Cubism.
French, Dutch, Russian, and Spanish are the only non-American nationalities to appear in the top 50 artists on display across US museums however Native Americans also frequent. 20th-century artists like Woodrow Wilson Crumbo (also known as Woody Crumbo) and Acee Blue Eagle, both from the Muscogee nation, were dominant in their native American initiatives. Now, their work can be seen in museums across the country.
What does the diversity of US museums look like?
As we know, the diversity of American art museums isn’t as distinct as it could be. With white, male, American artists fueling the galleries we see, we wanted to bring to life the reality of this data.
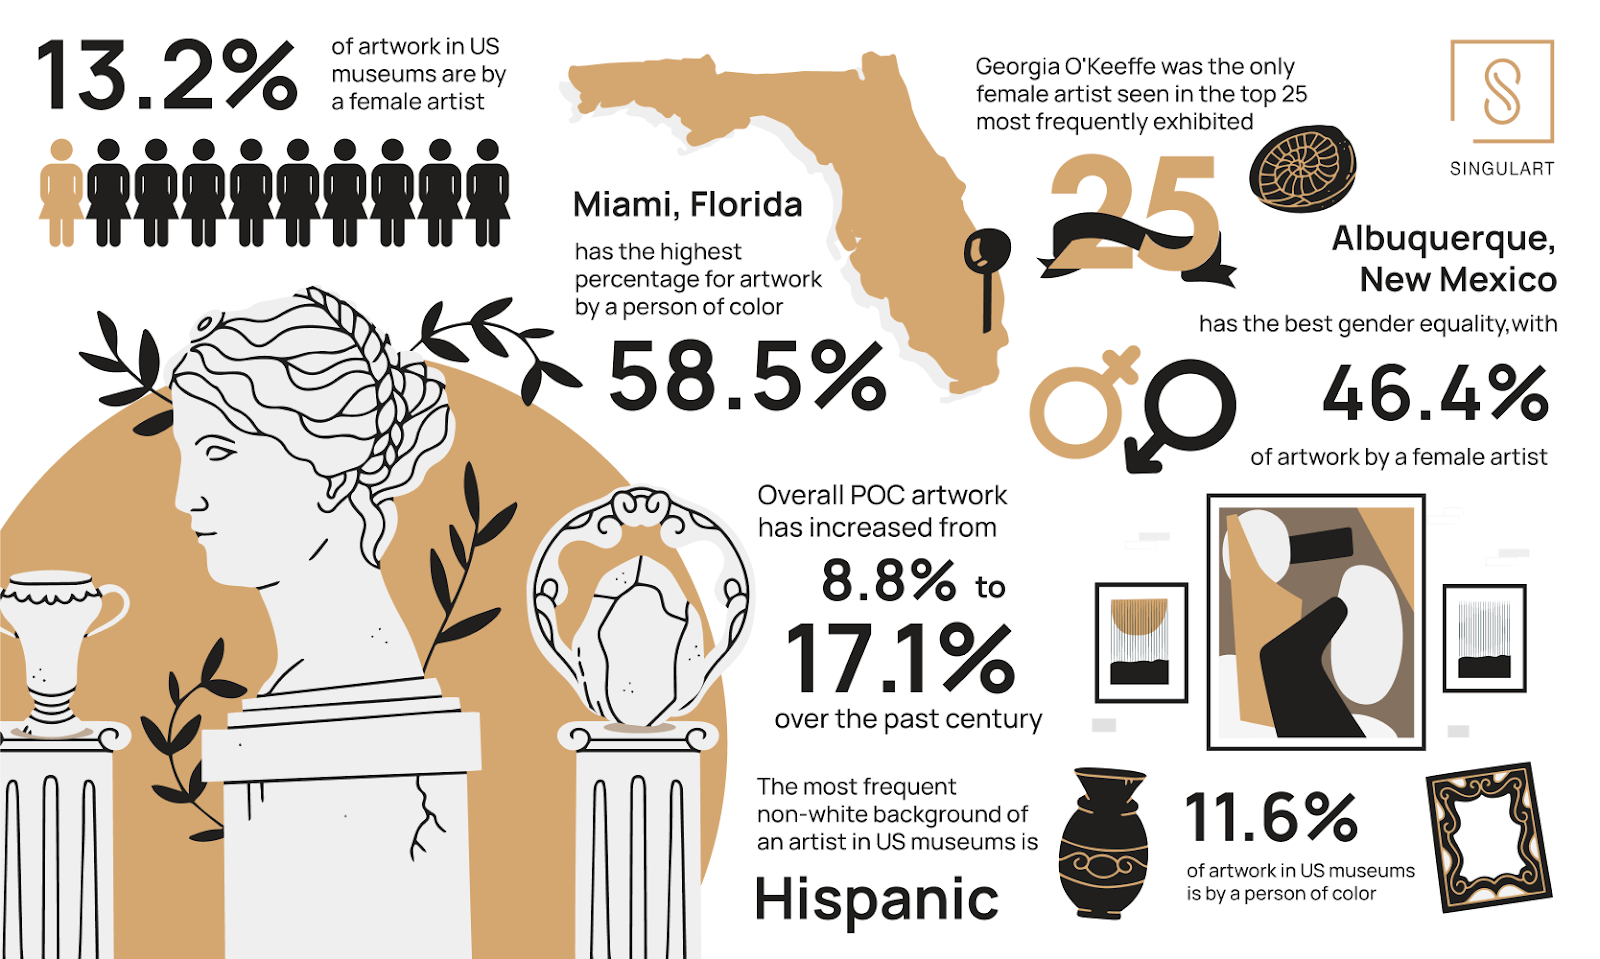
Visually, we wanted to show the current state of diversity within American art galleries, reflecting our statistical insights into gender and racial diversity among artists showcased in museums. Using Midjourney, we used prompts to create an image that represented how only 13.2% of the artwork in US museums is by a female artist and 11.6% is by a person of color within US galleries.
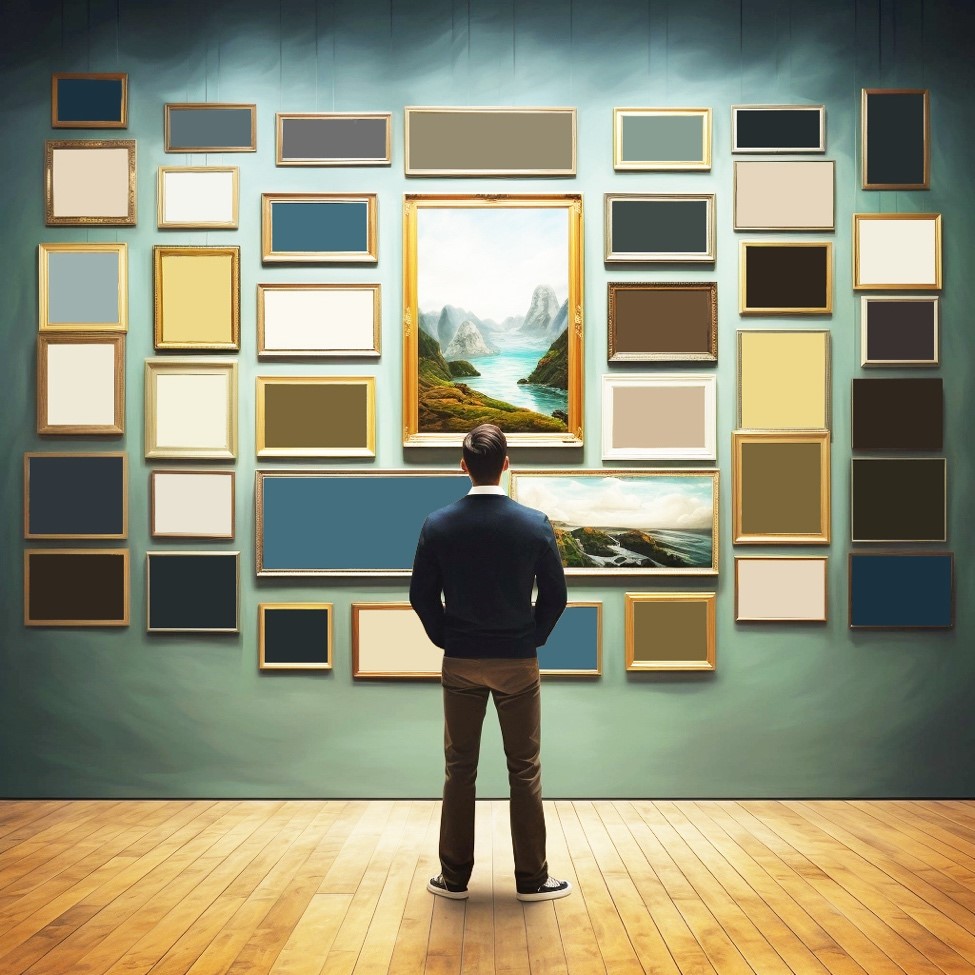
As you can see, most of the artwork in this image shows blank space. With unfilled frames representing the amount of artwork created by white males, there is no doubt that this group takes up a lot of space in US art galleries.
Where the filled frames represent non-white and female artists, only two artworks are filled by a non-white, non-male background. This is the reality of the existing diversity within the American art world and sheds light on the need for increased inclusivity.
We can see that there’s still a long way to go to expand the diversity of our art museums. By seeing this through a visualization of the art galleries we know so well, the image underscores the statistical imbalances of female artists and artists of color. The abundance of unfilled frames dedicated to white male artists speaks volumes about the lack of diversity in American art galleries.
It is an urgent reminder that our cultural spaces must grow to authentically reflect the diversity of voices, encouraging an inclusive art landscape that embraces the richness of American culture.
Conclusion
In conclusion, there are key patterns as well as disparities in artist demographics, across nationality, ethnicity, gender, and art periods.
American artists dominate the country’s museums, comprising 59.4% of artworks in the top 50 cities, with French, Italian, and Dutch artists following. Overall, only 11.6% of the artwork we analyzed is by people of color, showing a huge imbalance of artists from non-white backgrounds.
Gender disparity is evident too, with the ownership of art on display being split by 86.8% male to 13.2% female. These disparities vary by city however, with Albuquerque in New Mexico displaying a balanced gender representation while Raleigh, North Carolina exhibits the most significant gap.
The analysis of art periods shows a historical evolution, with the Contemporary Period (1960-2023) reaching 17.1% of art being by from a person of color (POC) representation, influenced by cultural movements compared to that of previous decades, with a range of ethnic backgrounds in artists fluctuating through art.
The top 50 artists are predominantly white, male, and American, with 26 of the top artists falling in that category. However, this list also included international representation from France, Spain, Russia, and the Netherlands as well as Native American communities.
In summary, this report highlights ongoing challenges and opportunities for diversity within US museums, showcasing efforts to diversify collections and positive shifts towards a more inclusive art landscape. Where American artists dominate the US museums naturally, there is still a chance for gender, nationality, and ethnicity to develop in the future of artists and what is exhibited in museum collections.
Further Commentary
The diversification of art within the US needs work by the galleries we visit, and this is reflected by the artwork chosen for exhibition. Here at SINGULART, we commit to becoming more conscious of our diversity and pledge to take action toward a more diverse art world, including our 2022 Impact Report.
At SINGULART, we are proud to report that 49% of the artists and designers we represent are women. Our future mission is to play a role in reshaping the art market to contribute significantly to building a more diverse and inclusive society. With connections to over 14,000 artists, we want our discussions on inclusivity and environmental considerations to resonate deeply and bring about tangible, meaningful change.
Including raising awareness of women-identifying artists, defining a better gender gap strategy, exploring diversity in a wider sense (awareness of Black American artists and raising expectations) as well as maintaining policies geared towards salary equity, we aim to take a stance that provides a channel for change.
Through investigating the nationalities and ethnicities of the artists in US museums we hope to increase the awareness of the gender gap in artworks, aiding our mission to foster a better understanding of the diversity of the US art market and museums and how we can create a better future for upcoming artists.
Methodology
We identified the 50 most populated cities in the United States, of which 29 were eligible for data analysis, with two or more art museums within each city. A total of 46,000 pieces of art were collected from over 16,000 artists, of which 10,713 artists were eligible, and scraped from the identified museums. This dataset includes artists associated with the ‘paintings’ and ‘sculptures’ categories.
From the official collection sites of the museums, we scraped additional data, including the name of the artist and the date of the art piece where available. Using AI, we conducted in-depth analyses of artist profiles available online. The primary metrics for assessing diversity include nationality, ethnicity, gender, and decade.
Backgrounds of ethnicity were aligned to the American Census to include White, Black or African American, American Indian or Alaska Native, Asian, and Native Hawaiian or Other Pacific Islander.
The art periods analyzed were classified as the Contemporary Period (1960-2023), Modern Period (1850-1959), Romantic Period (1800-1849), Neoclassicism / Neoclassical Period (1750-1799), Baroque Period (1600-1749), Renaissance Period (1350-1599) and Medieval Period (500-1349) as set out by Ridge Light Ranch.
Genderqueer and openly LGBTQ+ artists were also analyzed in this dataset. With negligent data to compare, these two categories were removed in the final analysis.
The data collected is accurate as of December 2023.